.png)
Network mapping and visualisation
Website: https://www.kumu.io
Price: Freemium (Free public projects, private projects $9/month or free for students)
License: Commercial
Skill level: 👩💻 End-user
Description
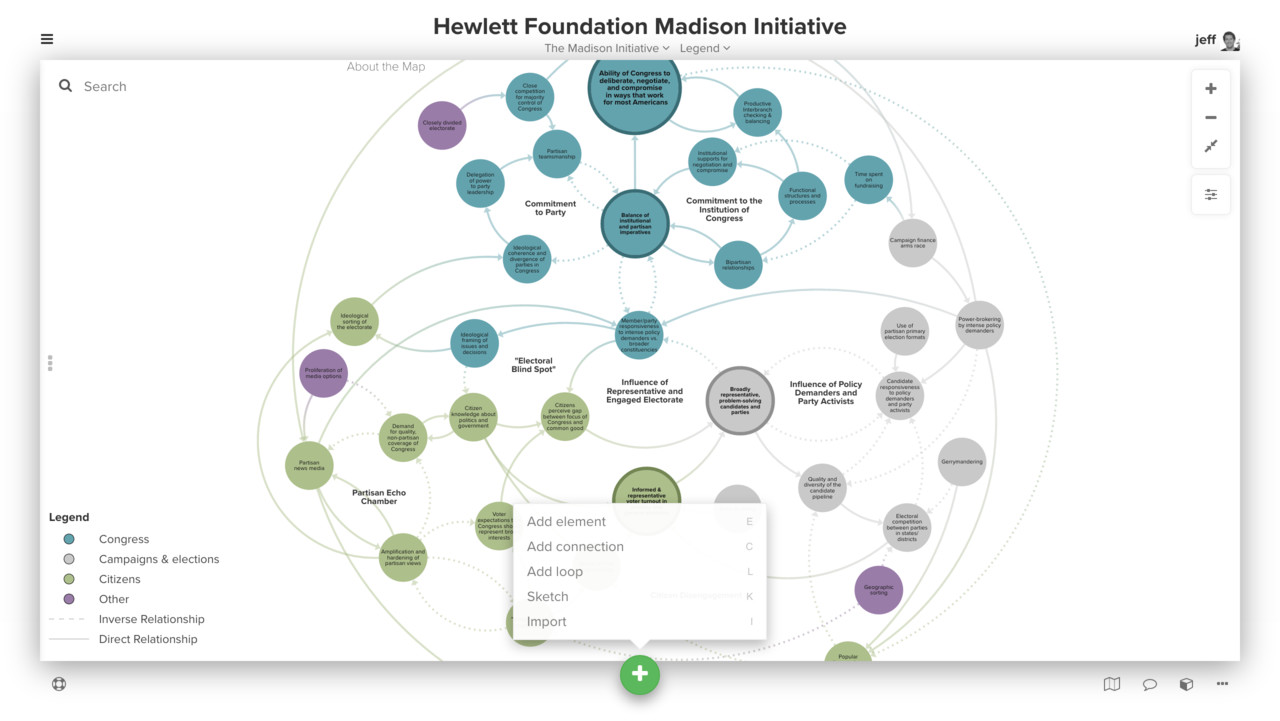
Kumu makes it easy to organize complex data into relationship maps that are beautiful to look at and a pleasure to use.
Create maps by hand, or import existing data.
It's easy to learn the basics in just a few minutes --- and free to get started! Start mapping in seconds with no downloads required.
Already have existing data? Our simple import format makes it easy to create a map from a spreadsheet. Import a local spreadsheet or use our Google Sheets integration to build maps from live data (or try crowd-sourcing your map by making your Google Sheet publicly editable).
Reduce complex relationships into compelling visualizations, fast.
Organize your project into multiple maps and views to capture different perspectives. Cut through the clutter using filter, focus and showcase.

- Hide all connections except those where strength is "high" using filters
- Show everyone within three degrees of a given person using focus
- Highlight key people and fade the rest of map into the background using showcase
- Create before and after views of the same map
Free for students and public use!
Registration is free and includes unlimited public projects (editable by you, viewable by anyone).
Working with sensitive data? We offer private projects starting at $9/month that are unlisted and can only be seen by others with your permission.
We also have free private plans for students!
More than a pretty picture, a visual database.
They say a picture's worth a thousand words, but some people like to know the stories behind the pictures.

Attach additional narrative and data to every element, connection and loop using profiles. We automatically include a few core fields to get you started (type, label, description, and tags). From there you can add as many additional fields as you need.
- Use the element description to provide a bio for each person
- Create a "skills" field to include each person's talents
- Track the operating budget of each organization (and even format as currency)
- Embed YouTube videos to introduce a person or topic in more depth
- Use the connection description to explain why two factors are connected
Style your maps with data-driven decorations.
Decorate individual elements and connections using the data you've added to the profiles.

Use our point-and-click builder to create dynamic data-driven decorations---changing size, color, line thickness and more!
- Size the width of connections based on funding amount
- Assign colors to people and organizations based on the sector they represent
- Size elements based on the number of incoming or outgoing connections
- Use a color scale to highlight relative strengths
- The possibilities are endless, but don't go too crazy... nobody wants to look at an ugly map!
When you're ready for more, use Kumu's powerful CSS-like language to unlock additional decorations and advanced features.
Discover insights through automated calculations.
Social network analysis, community detection, clustering, and more!

Use our built-in metrics (such as closeness, betweenness, and eigenvector centrality) to identify key elements and connections. Use our automated community-detection to color elements by community and identify bridges between communities.
Clustering makes it easy to connect elements based on mutual data. Quickly see everyone who works for a given organization or who went to the same school.
- Find the information brokers and bottlenecks in your network using betweenness
- Discover hidden cliques by running community detection
- Cluster by strategy and geographic focus to see a landscape of organizations in a given field
Make things easy with custom controls.
When you're ready to share your work with others it's important to make your map as easy to use as possible.

Our powerful view engine not only allows you to customize the style of your maps, but also the controls used to interact with it. Add custom dropdowns, buttons, text, images and more so others can use your map without feeling lost or overwhelmed.
- Add a dropdown that makes it easy to filter by element type
- Predefine showcase options to make highlighting regions of the map a breeze
- Include additional text and guidance directly on the map
- Remove built-in controls you don't need
Publish your work proudly with presentations and embeds.
Once you're done building your map, use Kumu's built-in presentation builder to unfold your map step-by-step so others can follow along.

Presentations can include more than just map slides:
- Use text slides to add rich narratives and context.
- Drop in an image or a chart to support your analysis.
- Embed a video from YouTube or Vimeo for better engagement.
Looking to share a single map on another website? Use embeds to create an iframe that you can add to your blog or website.
Whether you're using presentations or embeds, our publishing platform is built to handle as much traffic as you can throw at it (thanks to Amazon's Cloudfront CDN). Share your work with the world with just a few clicks!
